Back in March 2011, I wrote a web application to estimate how many Chinese words a person knows. The test works similar to a flashcard set: for each word presented, you mark whether you know the word (using your own judgment), optionally revealing the pinyin and English definition before deciding. A sample of 165 words is drawn from the top 36,000 in the Lancaster Corpus of Mandarin Chinese. At the end, the results are extrapolated across frequency bands to give an estimated vocabulary size. A Chinese character test was added later, with the same methodology, but at the character level rather than the word level. The app has been quietly running for 15 years now.
The app now has a new test – Vietnamese! It’s been something I’ve wanted to add since starting my Vietnamese studies last year, to get an estimate of my progress at various points. The test follows the same format as the Chinese ones – a sample of words drawn from a frequency list, marked known or unknown, with a vocabulary estimate at the end. Before the main test, there is a short pre-test with a few questions to gather some anonymous information about your current level of Vietnamese. This data will be used for future analysis, similar to the original research motivation behind the Chinese test. If you are a Vietnamese learner at any level, give it at try! The tests are all at https://www.zhtoolkit.com/apps/wordtest/.
Eight months ago I embarked on a new adventure, jumping into the Vietnamese language with almost no prior knowledge of it. With years of experience studying Chinese, I had some ideas on the methods I wanted to use. So how well did they work?
The number of hours I have put into studying up to now is roughly 300 hours. At first, I was solely grinding flashcards for about 90 minutes per day, since everything was unfamiliar and difficult. Once my spaced repetitions lengthened (and not adding many new words during this time), after a few months the daily reviews had shrunk to 30 minutes. In the past 2 months I have started adding new words again plus reviewing more aggressively. Now the flashcard reviews are consistently 1 hour per day. Five months ago I started weekly 1-hour tutoring session. Throw in some daily minutes for short readings, and the total over 8 months is roughly 300 hours.
How fluent am I?
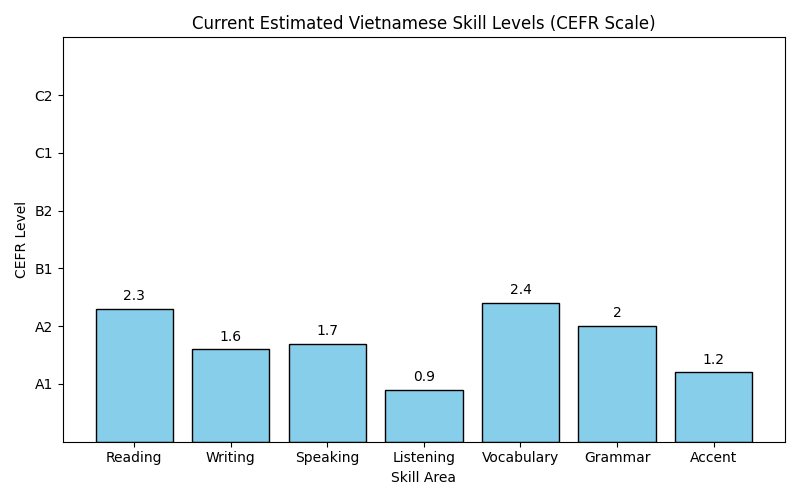
so where am I at, in this learning journey? At this point I am definitely in the advanced beginner category. In terms of the European CERF levels, I would say I’m in the middle of level A2 – not a beginner anymore, but not yet at the intermediate level. But I am better in some aspects than others. Listening ability has been particularly challenging, and it lags the other areas. So I prefer to think of levels per skill, which I would break down this way.
With a focus on vocabulary, I can read simple texts graded for beginning or intermediate learners. I am probably a few months away from being able to read easier native texts. I can make out the gist, but there are enough unknown words that the meaning isn’t always clear.
Writing and speaking are nearly the same level, since they are both producing the same output. Writing lags because of spelling errors, which is a particular challenge of Vietnamese. Using the Vietnamese TELEX input method, my mobile phone offers word suggestions to help autocomplete words. But typing on a computer requires exact spelling. My pronunciation has gotten better than it was for the first few months when I didn’t have formal instruction and had to make do. But I’m sure it’s still bad. My tutor can understand me most of the time, but my Vietnamese friends have a harder time.
Listening ability is particularly challenging for me. But it’s been that way for every language I have learned. Even when I can understand the individual words, I can’t process them fast enough to feel the meaning of the full sentence. I have managed to find a few websites that help practice this area, and I am improving, but slowly.
As for the number of words I know, I can estimate this a few different ways.
(1) A “mature” Anki card is one with a spaced repetition period of >= 21 days, which means it’s been successfully remembered multiple times. I have 4000 mature cards as of now. roughly one half are Vietnamese->English and one half are English->Vietnamese. I should also factor in my average historical forgetting rate of 85% for all mature cards. Thus, I probably know well at least 1700 Vietnamese words, plus more which I am in the progress of learning.
(2) The website 17 Minute Languages asks you to mark a frequency-ranked series of words that you know. After submitting the first set, a second more refined set of words will help hone in on a more precise estimate. Taking this test periodically, there are variations in the results each time, since the words are random. But it hovers around 1900. The site calls that an A2 level of knowledge.
(3) There is a version of my online Chinese word knowledge test that I use offline, with a Vietnamese word list instead of Chinese. This gives wildly different estimates every time I try it. When I tested a few weeks ago, I got 1755-2100 (+/-400). However, 4 months ago I got a result of 2176-3108, when I didn’t even have that many words in my flashcards. Knowing a random uncommon word bumps up the estimate a lot. I need to look into the software calculations, methods, and quality of the word list to hopefully improve the result quality.
—
While I am far from fluent, I can definitely notice steady progress. Many people know about the “intermediate plateau”, where getting from intermediate level to advanced fluency takes a long time and a lot of effort. But I think there is also a “beginner’s plateau”. At the beginner level you build up your knowledge of grammar and frequent words. But to reach the intermediate level, you need to be able to read and listen to more native content, and that requires a level of language knowledge that is not a smooth jump from a beginner level. So the progress from A1 to A2 can happen quickly and smoothly, but from A2 to B1 takes an extended effort over a longer time. I only started to notice reading become easier a month ago, or 7 months into my study. I had been trying to read a difficult native level text, full of colorful prose with rare words that I had trouble remembering. One day I accidentally turned to the forward written by the author, instead of the main text. And I could understand it! I came across many words I had studied as flashcards, so I was adding additional mental connections for useful words. If I had more access to reading material graded for advanced beginners I would have more opportunities like this. Finding resources like this has been a challenge in Vietnamese, which doesn’t have the same numbers of learners as the most popular foreign languages to learn.
What worked?
Curated sentence flashcards: I knew I wanted to start with not only word study, but sentence flashcards in order to quickly get familiar with grammar patterns and word clusters. I found one deck, Vietnamese to English vocab and practice, that contained 500 sentences, a decent collection of grammar examples and beginner level words. As new sentences were introduced daily, it was interesting to see the way my understanding of the grammar grew. Sometimes I had a theory on a grammar point or the meaning of a phrase based on the sentence and translation. But then when I encountered another card later, it might disprove my theory and I would need to modify my understanding.
Curated word lists: Similarly, I used the same downloaded flashcards as my initial list of 1000 words to study. Again, it was a fairly decent set of words for a beginner. It took exactly 6 months before all the cards had been introduced, as I was limiting myself to 100 cards per day and 20 new cards maximum. This tended to slow down the rate of new words as time went on, as more and more of the 100 daily cards were taken up by reviews. I finally upped the daily limit to higher numbers, which finally led to the last new cards being added.
Tutors: Studying languages alone as a hobby can be fun but still challenging. In Vietnamese, it was particularly hard due to needing to learn pronunciation rules. I had a textbook that was quite thorough with linguistic descriptions and tongue positions for how to pronounce sounds, but with no audio examples I had no idea whether I was understanding the proscriptions correctly. YouTube and podcasts had occasional clips that described some pronunciation highlights, but nothing that had the comprehensive set of rules that would help me read anything I would encounter. Additionally, there are some differences between Northern and Southern Vietnamese, which narrowed the available content even further.
SVFF, or Southern Vietnamese For Foreigners is a Saigon-based company that provides 1-on-1 lessons, video courses, and structured learning materials. I chose the teacher whose introduction sounded the most focused on using technology for teaching, which I saw as a plus. We have weekly 1 hour sessions on Zoom. Often there will be a fun game or quiz to get a conversation started, but the lessons are mostly free-form discussions that expose new words and expressions. Each lesson I speak more and more, and even though there are frequent mistakes, those are opportunities to learn something new. In addition to the class, there is a good set of offline reading material, including detailed pronunciation guides. Not only was it the full set of instructions on how to pronounce all the sounds, but it was attentive to the particulars of the Southern accent, or even Saigon-specific accent.
Graded readers: Along with the grammar books I bought and quickly moved on from, I obtained one book that was a graded beginner level reader, “69 Short Vietnamese Stories for Beginners” by Adrian Gee. Once I learned my first 1000 words from my flashcard set, these stories were a simple 5 minute read (about 150 words each). Each story introduced some new words specific to the topic, with definitions after the story. Besides those, there were around 5-10 additional words in each story I didn’t know, so I was constantly adding extra words to a flashcard set.
Graded audio stories with dictation practice: I wanted some way to improve my listening skill, but random YouTube videos were not cutting it. I needed something slower and simpler that wouldn’t overwhelm me. I found Langi, which has fun news stories with audio from levels A1 to B2. The different skill levels seem to be the same stories, just with longer sentences and harder words. In addition to audio narration of the whole story, there is an exercise to review it sentence by sentence. There is also a dictation exercise, where you need to type each sentence as you hear it, repeating the audio as many times as needed. This is a difficult exercise, but it has been a huge help in improving my spelling. When reading, it’s easy to gloss over a faulty memory on word spelling, but when you have to produce a 100% output, mistakes are an opportunity to rewire brain connections.
I am aware of a different service, Glossika, but I have not yet tried it. This site has individual sentences rather than stories, but it may also be an effective practice, and I plan to try it out soon.
Motivation: Despite being a challenging language to learn, I have been enjoying the process so far. Progress is slow but still noticeable. I do flashcard reviews nearly every day, my longest streak being 78 days in a row. I don’t know yet how far I will go before I’m satisfied with my level, but for now I am excited for the future and my expanding my skills.
What didn’t work?
Not learning pronunciation right away: Due to a lack of good learning resources, I started studying with an incomplete understanding of how to correctly pronounce written words. This meant that even though I was learning words and sentences through flashcards and even with correct spelling, I still wasn’t pronouncing them correctly. With the help of tutoring resources I did finally learn, but I did have to relearn words that I had been saying wrong.
Anki decks of the “top N words”: This is something some language learners propose will get you to fluency quickly. Since 80-85% of a typical text is from the 1000 most frequent words (at least for English, see Nation, P. (2006)), all you need is to memorize the top 1000 words and you can basically understand anything. But note that those same research articles tested how much a learner could comprehend from knowing 80%, and it was basically gibberish. From expirimentation, most learners would need 98% coverage to comprehend a text.
I wasn’t completely convinced that a list of the top 1000 words would be the key, but I thought I would give it a shot. I quickly gave it up after a few days as being completely worthless. A large number of those words are grammatical connectors with vague and multiple definitions as isolated words. Trying to memorize them out of context was both nearly impossible and unenjoyable.
Audio flashcards from native content: Despite my listening skill being challenged, I thought if I just practiced listening to native content with determination, I would have to improve. I downloaded audio from podcasts, used the Amazon transcription tools to convert it to a subtitle file (which worked impressively well), then another tool to split the audio and transcript into Anki flashcards. In addition, I pulled new words from the transcript to make definition flashcards. The result was just too difficult to have any benefit.
Immersive input: I take no stock in massive exposure to incomprehensible audio. In fact, I think it’s worse than doing nothing, because it gets you accustomed to tuning out and accepting that you don’t understand anything. But I thought that if I had free time anyway, why not just put on a podcast and maybe I’ll get something out of it. But hours of listening gave no benefit at all, picking out around 1 word every 5 minutes. Yet, if I had the transcript where I could read at my own speed, I might understand the gist. I will need a lot more low-level listening practice to bring up my level to my other skills.
Flashcards from native texts: Extracting difficult words from a text into flashcards to help with understanding wasn’t a terrible experience, but it wasn’t as effective as I expected. My method was to use a version of my Chinese Word Extractor that worked with Vietnamese (still in progress), filter out words only used once, and pick words that were more frequent in the text than in the language as a whole. I may have picked up a few useful words this way. But most of the words were less helpful for comprehension than their frequency in the text would suggest. Many of the words picked up by this method are just colorful literary synonyms used only in print but not in the spoken language. Another lesson learned from this experiment is to only make flashcards for Vietnamese to English, and not from English to Vietnamese. A method I have found more effective for reading is just read without any vocabulary preparation, and to only make flashcards for the unknown words that are essential to understanding the meaning of a sentence.
What’s next
For now, my plan is to mostly continue my existing methods. I continue to add 10-20 new flashcards every day, so my knowledge will slowly progress. I am already able to understand easier YouTube content made for learners, so listening practice is something that I can slowly increase. I would really like more offline books for free relaxed reading. The most exciting plan for the future is that I will be going back to Vietnam in 2 months. After 10 months of study, I want to know how my experience will be different when the language is no longer incomprehensible.
While I do enjoy studying Chinese words using Anki, I must admit it can feel like a chore much of the time. I tend to aggressively focus on challenging words, which often means that my queue for the day is filled up to the daily limit, and also that I’ve given myself a challenging workout. My usual habit at the beginning of a session is to check Anki’s forecast graph to check, even though I had a lot to study today, when my diligence will pay off.
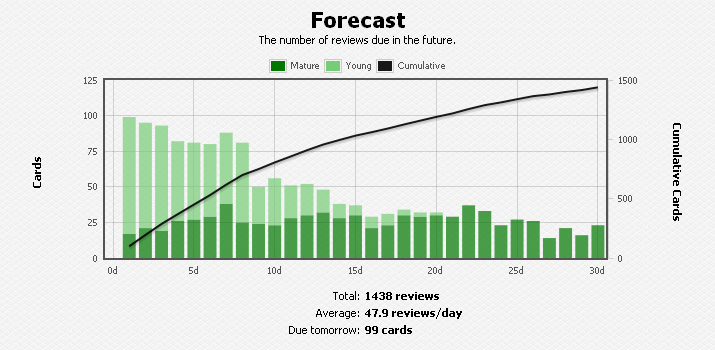
Anki forecast at day 105
It is a real encouragement to see how great the future looks. While I have 99 cards to study today, all I have to do is study hard for about a week, and the number of cards due will be down by half. The graph continues to indicate reductions in the number of cards day by day, leveling off after two weeks to about 25 cards per day. I can imagine how awesome my study routine will be two weeks from now, when the spaced repetition algorithm will just require me to pull up Anki a few minutes a day of flashcards to in order to retain learned material.
The next day when I fire up Anki, I still have a lot of cards due. That’s alright, because I knew I had a few days before the daily load started it’s decrease. It’s still about two weeks before the magic leveling off of 25 cards. I did have a few lapsed reviews during the session, which probably explains it.
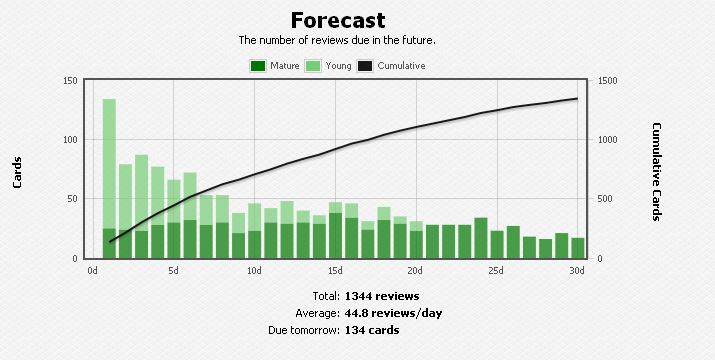
A week later, I’m still waiting for the promise of a smaller daily schedule. The graph below is my forecast a week after the first graph. Not only does the forecast look no better than it did a week earlier, but the number of cards due tomorrow is 35% more than it was a week ago!
Anki forecast at day 112
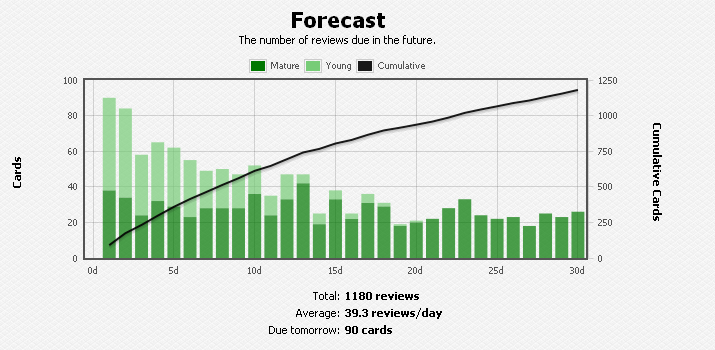
After two more weeks, I’m looking forward to the green pasture of 25 reviews a day. But wait, what’s this? What the…??
Anki forecast graph at day 126
So after three weeks of studying daily, my daily queue has gone down from 99 cards, to … 90! What is going on with the forecast graph, and why is it so far from reality?
When the Forecast Isn’t a Forecast
Actually, the forecast graph is doing just what it was programmed to do. When it claims that I will have 99 cards to study tomorrow, it is entirely correct. Where it starts to go off the rails is in all the days after tomorrow. The counts for those days do not account for the cards I will study tommorow which will end up as lapsed. Cards that lapse tomorrow will be rescheduled on day 2, increasing the actual number of reviews from what the graph shows. It also doesn’t account for all the successful reviews tomorrow, which will all be rescheduled sometime further in the future, with some of them being within the 30-day window of the graph. All of these rescheduled cards will add to the original forecast in those future days.
In other words, the forecast graph isn’t really meant to be a “forecast” of the number of cards you are likely to study. The graph is really just showing the number of cards due on each day in the future, as of this date. In fact, the source code for the graph uses terms like Due, IsDue, etc., for it’s functions, never referring to it as a forecast. A real forecast would be much more complex, and would need to run projections on probable number of successful and failed cards for each day in the future to adjust the daily counts. That would be a pretty cool feature, but isn’t what the software currently does.
An SRS-yphean Task
What about my experience of doing daily reviews, yet not making clear progress in lower my daily queue? Can this all be from a small number failed reviews?
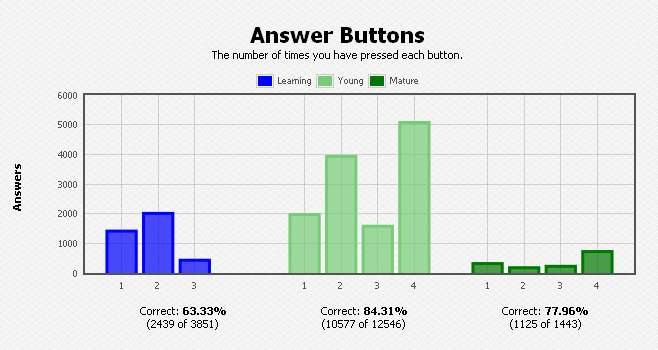
Anki has a graph that directly shows the propabilities for success and failure for a particular deck, or for all decks. This is the “Answer Buttons” graph (“The number of times your have pressed each button”). This charts the number of times each answer button (1=Lapsed, 2=Hard, 3=Good, 4=Easy) was pressed for different types of cards. Ignoring the blue Learning section on the left (which just indicates how many items you already knew), the Young and Mature areas of the graph indicate how well you knew items as they were reviewed. The Young subchart represents items that were last reviewed 21 days ago or less, while the Mature chart on the right side represents cards that were last seen over 21 days ago. The Young subchart includes some items that are difficult to remember and are repeatedly forgotten, so the average Answer Buttons tend to look less favorable compared to the Mature subchart. Mature cards have all been seen and answered successfully many times in a row, so the Mature subchart is more representative of the overall success rate of the deck. The Anki documentation suggests that the success rate (buttons 2 through 4) should typically be around 90%.
Anki’s “Answer Buttons” Graph (for a different deck)
In fact, the SRS algorithm is constructed by default to aim for this level of performance, based on the model of memory where the chance of forgetting a fact increases over time. If you wanted a higher percent of success in your SRS sessions, you would need a more aggressive daily schedule because you would be reviewing items more frequently. If you wanted a more relaxed schedule, you would be doing less reviews but would have more lapses. The various algorithms in SuperMemo allow fine tuning of many scheduling factors based on empirical data from past reviews. Anki allows a small amount of control via the Interval Modifier deck option.
A success rate of 90% seems great. It’s enough to get an “A” grade here in American schools. But a failure of 1 item in 10, or of 10 items in 100 somehow seems worse. For an SRS future schedule, it’s a significant amount. Here is the effect it has for a hypothetical deck. Say that I have a schedule of reviews as follows:
Day
Number of cards due
0 (today)
100
1 (tomorrow)
90
2
80
3
70
4
60
I have 100 cards due today. After my review session, I have successfully remembered 90 of them but forgot 10. These forgotten cards are repeatedly shown until I remember them, at which point they will be rescheduled for tomorrow. Before my review session today, there were 90 cards due tomorrow. After my session, there are now 90+10 or 100!
The next day, the situations looks slightly better. While I still have 100 cards to review, there are only 80 cards the following day instead of 90. I am likely to have around 10 lapses again (note that, except for yesterday’s lapses, these are all a different set of items than yesterday, so the chance of forgetting is the same). Thus, on day 2 I will have 90 reviews instead of just 80. In addition to the lapses, the 10 cards that were lapsed on day 0 and successful on day 1 will be rescheduled for day 2, 4, or 5, depending on how easy I marked the card.
Which has a greater influence on increasing the future queue — lapses or rescheduling? The answer wasn’t immediately obvious to me, so I set up a simulation, using the Anki simulation in Python discussesd in a previous post. I set up an initial deck to match the cards and review history in my actual deck. The particular deck has a lapse rate of about 15% (more precisely, 14.7%). Once loaded, I let the simulation run through a number of days of reviews, recording lapses and reschedules for cards that were reviewed from the first day (day 0) of the simulation forward. The answer is immediately clear:
Contribution of various factors to Anki’s review queue
The graph above conveniently combines two different but important data sets: the forecast as of day 0 of the simulation and the actual reviews on each day. The bottom area in blue is the number of cards due on future days as of day 0. Thus, it is equivalent to the forecast graph in Anki. You can see that the number of reviews quickly drops, reaching 20 reviews or below as of day 26. The combined area of all three data sets represents the number of items that were actually reviewed on each day. It is the combination of the original forecast plus any items reviewed from day 0 through day N-1 that were rescheduled. The items that were successfully reviewed and rescheduled again during the 30 day window is a minor contribution. The major contributor to the daily queue is clearly from lapsed cards. It’s such a major factor that as of day 25, the majority of reviews are coming from items that had lapsed in the previous 24 days. It’s like slow, rolling wave of forgetting.
What does it look like with a success rate better than 85% — say 90, 95, or even 100%? It’s hard to do a direct comparison because other factors come into play. While a lower rate of lapses obviously will lower the number of rescheduled reviews with all other factors being equal, a deck with fewer lapses will already have fewer scheduled cards on any given day. The graph below simulates forecast atarting from day 105, in a deck made by the addition of 20 cards a day for 100 days, followed by another 5 days of reviews with no further additions. In a deck with a 15% lapse rate, the number of cards due tomorrow is around 140, which in a deck with a 0% lapse rate, there are 80 cards due tomorrow. Two interesting observations are that the forecasts in both decks level off to 25 cards a day after about 3 weeks, and that the forecasts for both are equal after about 8 days. The dramatic difference is that the high-lapse case promises a quick drop in the number of reviews to reach that point. As we now know, that promise is not fulfilled.
The forecast for two simulated Anki decks with varying lapse rates
The Conclusion
If the prospect of a small number of reviews in the near future keeps you motivated to keep up with your flashcard study, don’t let this analysis discourage you! But if you find yourself repeatedly surprised by how your daily reviews are higher than Anki’s rosy forecast, know that you’re not doing anything wrong. Just keep plugging away. Your daily reviews will slowly but steady decrease over time, just not nearly as quickly as Anki’s forecast would have you believe.
The HSK is a well-known skill level test used by the PRC to assess language proficiency in Chinese. Even for those who have no interest in taking the HSK test, the lists of Chinese words associated with the test are a convenient source of material for learners to study vocabulary. I have used these word lists myself with great success; it was a quick and effective way to gain a huge amount of usable vocabulary.
In 2010, the HSK exam underwent a major reworking, changing the structure of its skill ranks, increasing emphasis on speaking and writing, and revising its vocabulary. Where the “old” pre-2010 word lists consisted of 8,000+ words across 4 levels, the “new” HSK has 5,000 words distributed into 6 levels. Below is a summary of the word counts in the old and new vocabulary lists, based on actual word lists obtained from various sources (see footnotes for details). Note that these include a small amount of double counting (less than 2%) due to words repeated at more than one level, because of either different pronunciation or meaning. Also note that these counts differ slightly from the official word counts reported by Hanban.
Word counts in the old and new HSK word lists
Level
old HSK
new HSK
1
1007
153
2
2001
150
3
2189
300
4
3587
600
5
–
1300
6
–
2513
Total
8784
5016
Since I had invested so much time in studying the old lists (up to level 3), it was natural to wonder whether I should continue studying my existing flashcards or switch to the new HSK lists. How many words have I learned that are deprecated by the HSK, and does it mean they are unimportant? If I did switch, what level should I pick to start studying ?
Since starting Chinese, my studies have been mainly on developing reading ability. Not being in China or having regular language partners, my main window into China has been through text, so it made sense to take that approach. But more and more, I feel I’m missing out on enjoying all the audio and video content out there, which is easily accessible these days over the internet. I do occasionally listen to spoken Chinese for study purposes, but I have made very little progress in that area. At the beginning of this year, I changed my study ritual to focus much more on developing listening skills. In this post, I’ll share my experience thus far and various other thoughts. Please remember that this is just sharing my own experience and, as with any advice on language learning, your mileage will definitely vary!
I have started to analyze some of the results from the word test experiment. While I continue to crank through the data, here is an early result that I found interesting.
What this shows is the estimated word count, as extrapolated from the tested samples of each test, of over 200 trials, grouped by self-reported skill level and fit to a Gaussian distribution. The bar height is the mean value for the estimated known words, and the error bars are +/-1 standard deviation for the Gaussian distribution. Yes, that’s quite a large deviation, and it’s not surprising given the many sources of variability in the data: sampling error in individual trials by using 165 samples out of 36,000; self-reporting skill level in one of 6 categories — beginning to advanced and native — with the meaning of the categories undefined; and individual choice of what it means to “know” a word. This is all in addition to the natural distribution of skill within one of the 6 defined categories. Also, keep in mind that +/-1 standard deviation is only about 68% of the data. Thus, while the graph makes a nice linear progression by advancing skill level, the results are probably fuzzier than they look.
Despite the overlap in known words for each skill category, there are clear definite realms for each level. If you score 7,000 words on the test, you would be similar in knowledge to others in either the lower intermediate or the intermediate level, but you definitely know more than most beginners, and less than most high intermediate or advanced learners. So, this chart may be useful if you’ve gotten a word score from the test, and want to find out if you’re at the skill level you thought you were. Of course, there is much more to language skill than the the number of isolated words you know. Ultimately, the only person you have to satisfy is yourself.
People study foreign languages in many different ways. Because my main goal is reading, my particular method for studying Chinese places a large emphasis in acquiring receptive vocabulary, knowing the pinyin and the definition of words from the written characters. This is done through either flashcard software (I use Stackz) or spaced repetition software (like Anki). If I have an electronic text available, I use home-grown scripts to segment the text into words, and then create a word list of all the unique words. If I only have a printed book or magazine, I pick out the unknown words by hand, although this can be overwhelming with a difficult text.